Our cam calculation secret to
success is in the background, invisible
www.gaenssle.de
30% more valve
lift while reducing forces by 60%
How do we do that?
Read on - we will reveal the secret.
All you need to succeed: correctly calculated cam lobes!
A preliminary note:
Calculating the cam of a combustion engine can be done for redesign, replacement
or improvement. Let us demonstrate the power of calculating cam lobes with
KnockSoft using a typical example which is in no way extraordinary. Comparing the
original cam lobes and the newly calculated lobes is the best way to show the
possible improvement.
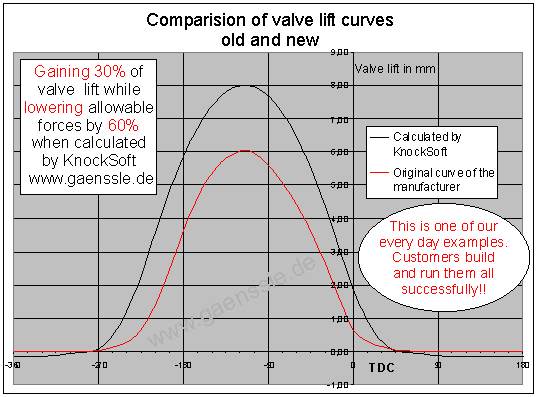
Valve lift curve
The valve lift curve shows the lift of a valve over the crankshaft rotation. 0
degree crankshaft rotation equals top dead center (TDC) of the piston. The cam
timing displays during how many degrees of crankshaft rotation the valve is
opened. Usually (like in this example) the valve timing is measured at 1mm valve
lift, i.e. the intersection point of a line parallel to the x axis at 1mm lift
and the valve lift curve.
The above diagram
shows the valve lift curves of a four stroke engine.
Red - factory stock,
black - as calculated by KnockSoft.
At the first glance two valve lift curves without extremal values. The
black
curve has a duration of 255 degrees, the
red
one has less lift and duration.
There is nothing especially noticeable, even for those who already have measured,
analyzed or otherwise have dealt with such curves.
The extremely serious advantages of KnockSoft cam lobes are invisible when
looking at the camshaft itself or at the valve lift curves. But analyzing the
actual acceleration shows the huge advantages of cam lobes calculated by
KnockSoft. (See the diagram below). The force necessary for moving the valves
grow proportionally with acceleration and moving mass:
Newton's law: F = m
x a
Force equals mass by acceleration
Mass and acceleration are the indicators for the dynamic load capacity and the
quality of the valve train.
Low mass and low acceleration mean low forces necessary to operate the
valves. They stand for a high rev, durable and low friction valve train.
In other words: There is only a limited time available for opening and closing
the valve. The cam lobe should be calculated in a way to ensure that process is
taking place just in a controlled manner at maximum engine speed along with
lowest forces necessary.
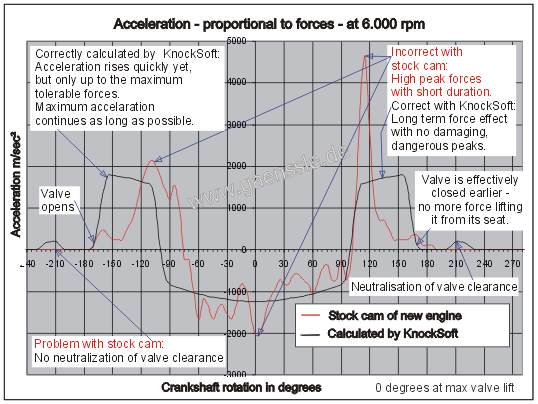
Before opening the
valve:
The valve, as accelerated by KnockSoft -
black curve - experiences
a soft elimination of the valve clearance just before opening starts, in order
to minimize possible oszillation. The
red
curve doesn't do so, or much too late. The opening can be superposed by
oszillations.
Opening the valve:
The black curve runs up the acceleration as quickly as possible, yet only up
to a computable, acceptable limit. Exceeding these limits may cause bent
pushrods or valves, seizures or premature wear. Acceptable limits can be
computed exactly. An acceptable limit may be e.g. the bending force of a
pushrod, calculated by Euler's formula. The surface pressure between cam lobe
and flat-base tappets may be such a computable limit. The
red
curve wastes valuable opening time with no important acceleration, while "catching
up" later with two unneccessary high acceleration peaks. Anything accelerated
for a long time reaches high speed - something we know when driving a car or
from physics lessons. Therefore, the
black curve stays at
maximum acceleration as long as possible.
Transit to max lift and starting to return to the valve seat:
At the end of the opening acceleration the
black curve changes
its sign immediately. The valve is decelerated as quickly as possible by the
valve spring and stands still for a short period of time at maximum lift. The
red
curve procrastinates when changing its sign, again wasting valuable time. The
red
curve shows several peaks of up to 30% over the required value, both at
deceleration until max lift as well as at the acceleration for returning to the
valve seat.
Closing the valve:
The valve is accelerated back to the valve seat by the valve spring. Prior to
thudding onto the seat, the valve must be "caught" smoothly, i.e. decelerated.
Both acceleration curves change sign again and rise into positive values. The
red
curve does that not as hesitantly as at the first sign change, but it exceeds
the black curve's value by 250% (5,700 m/sec˛). After the valve has been
decelerated with unnecessarily high forces, the remaining time is wasted with
acceleration far beyond the acceptable maximum. At the end of the closing
process, with the black
curve the valve sits on its seat under full contact pressure and transfers its
heat to the cooling seat. With the
red
curve, there are still forces applied. The extended heat transfer cools down the
valve which in turn increases power output and decreases emissions. There is no
clearly defined elimination of valve clearance with the
red
curve.
Final note:
It is obviously that the improvement by calculating the cam lobe as described
above is not always possible. Once a cam lobe has been computed correctly, there
is no gain in re-computing it again.
Important: This calculation is a physics problem, and its solution is either
right or wrong.
All solutions containing well known buzzwords as "re-calculated valve lift curve",
"modified lobe", "reground cam", "modified center lobe" or "proven cam profile
from another engine" have one thing in common - they are wrong.
There is a remarkable number of camshafts which can be improved. Even a 2004
model does not stand for a good camshaft - there are both correct camshafts but
also those which are even worse than described above. Camshafts prior to 1980
could be improved with no exception.
Interested?
Order your analysis at
Gaenssle as a first step.
We will show you in print whether your camshaft is correct or not.
We have the perfect solution for incorrect cams or new design.
© Axel Gaenssle
www.gaenssle.de